I Built a Charting SaaS, Then Shut It DownProject
I built Atlas: a Streamlit charting tool with six chart types, three visual themes, CSV upload, tiered exports, and a working payments gate. Then I checked who I'd actually be competing against and shut it down. This is what got built, and the numbers that made me stop.
It ran solo, end to end: chart engine, a heuristic auto-chart-type recommender, watermarked free exports versus a paid unlock, and a test suite. Last commit was March 2026.
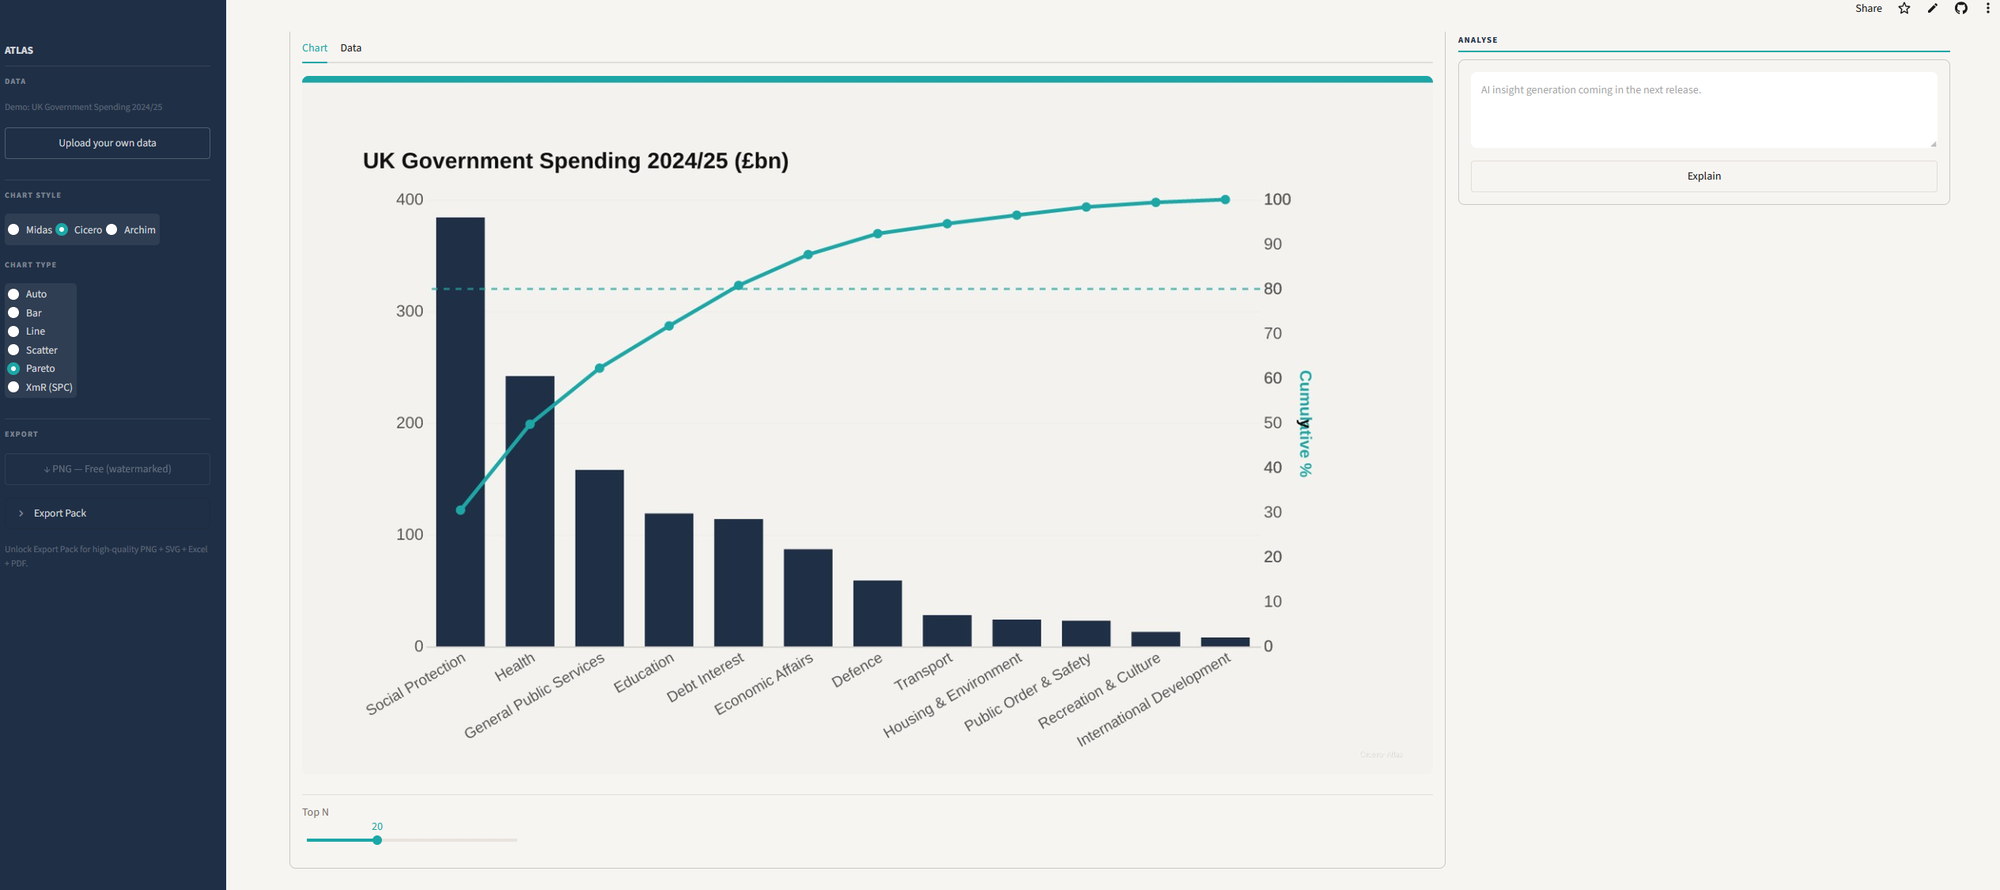
What it does
- Six chart types: Auto, Bar, Line, Scatter, Pareto, and XmR (statistical process control). Pareto and XmR aren't default options in most lightweight chart makers, both are operational-analysis tools rather than generic BI charts.
- An actual auto-recommender, not a gimmick: the "Auto" mode profiles uploaded columns (numeric, datetime, categorical, boolean, ID-like, text-like) with heuristics on uniqueness, missing values, and cardinality, then suggests a chart type with a confidence score, rather than leaving the user to guess.
- Three visual themes (Midas, Cicero, Archim) applied consistently across every chart type.
- A real tiered export path: free exports render through Altair/vl_convert and get a watermark stamped on; the paid "Export Pack" unlocks watermark-free high-quality PNG, SVG, Excel, and PDF, gated by an entitlement check module, not just a UI toggle.
- Bring-your-own-data via CSV upload, or one of the built-in demo datasets (the UK government spending breakdown above, A&E four-hour wait times, NHS trust completion rates).
What didn't ship
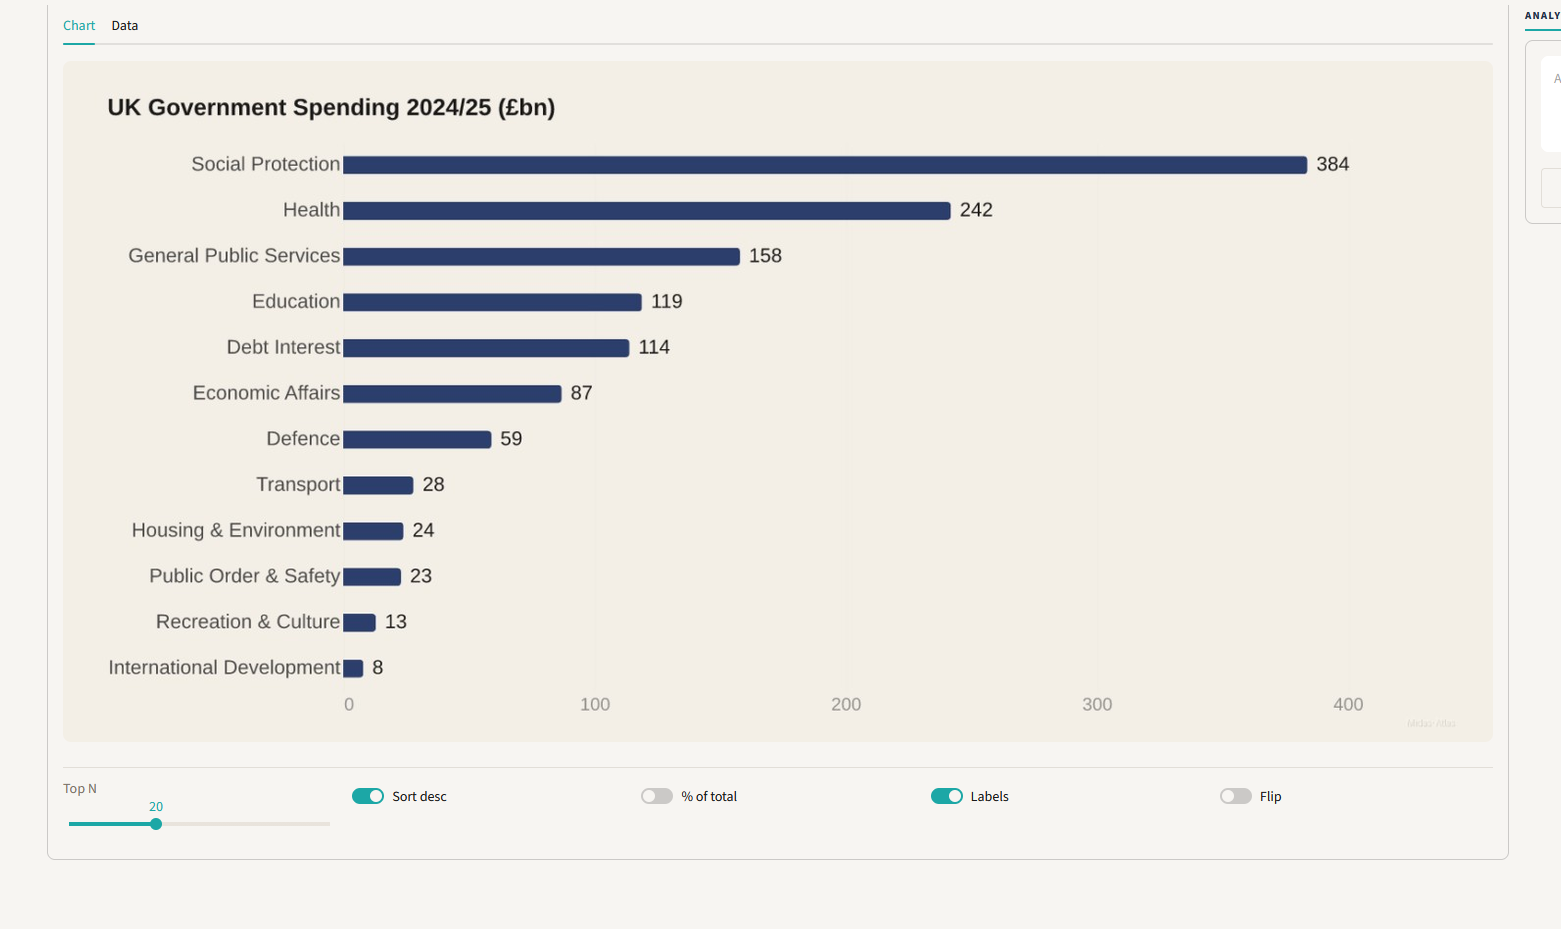
An "Analyse" panel sits next to every chart with an "Explain" button. The placeholder text was still "AI insight generation coming in the next release" when development stopped, scaffolding for a feature that never got built. Worth saying plainly rather than cropping it out of the screenshot.
Why I stopped
Before sinking more time into it, I checked the actual competitive landscape rather than assuming there was room. The data visualization tools market is large and growing, valued at $13.71bn in 2026 and projected to reach $34.07bn by 2034, but a large, fast-growing market is exactly what draws in competitors rather than leaving space open.
Two incumbents already hold a large share of it outright: Power BI at 18.27% market share (113,879 customers) and Tableau at 13.89% (86,603 customers). And the specific niche this tool targeted, lightweight, no-code charting for non-technical users, is already served by a long tail of free tools: RAWGraphs, Google Charts, Apache ECharts, Datawrapper, Flourish, GraphMake, and Looker Studio all compete directly in that space, several of them free with no watermark tax.
Pricing didn't leave much room either: no-code charting/dashboard tools in 2026 range from free up to $575+/month, with most sitting in the $12-79/month band, a narrow, already-contested range for a paid export unlock to differentiate in. Building the product wasn't the hard part. Finding a reason someone would pick it over an established free tool was, and I didn't have one.
Sources
- Source code: github.com/DragonsBones/atlas-lite
- Market size and growth: ThoughtSpot, 13 best data visualization tools 2026
- Market share (Power BI, Tableau): 6sense, Tableau Software market share
- Free/lightweight competitor landscape: FusionCharts, Top Data Visualization Tools 2026, GraphMake, Best Free Data Visualization Tools 2026